Salesforce and Rule Execution Service Event Logging
InRule Salesforce Logging
This section will highlight how to configure and view event logging for the InRule for Salesforce App.
Enable InRule for Salesforce App Logging
To enable logging from the InRule for Salesforce App, first navigate to Setup > Develop > Custom Settings.

Once you're in the Custom Settings page, locate the InRule custom settings object and select "Manage"

Select Edit. Here, you can configure the LoggingLevel custom setting that will define whether or not the InRule for Salesforce App logs to Salesforce and how verbose of logs it will create. The field can be configured with values from 0-3, with each signifying the following:
- 0 – Disables all logging
- 1 – Logs errors and a minimal amount of information on successful requests
- 2 – Logs errors, request information, rule engine notifications, and rule engine validations
- 3 -- Logs the same information as 2, but also includes JSON from the HTTP request and response payloads

Once you have configured the LoggingLevel, select "Save."
Viewing InRule for Salesforce App Log
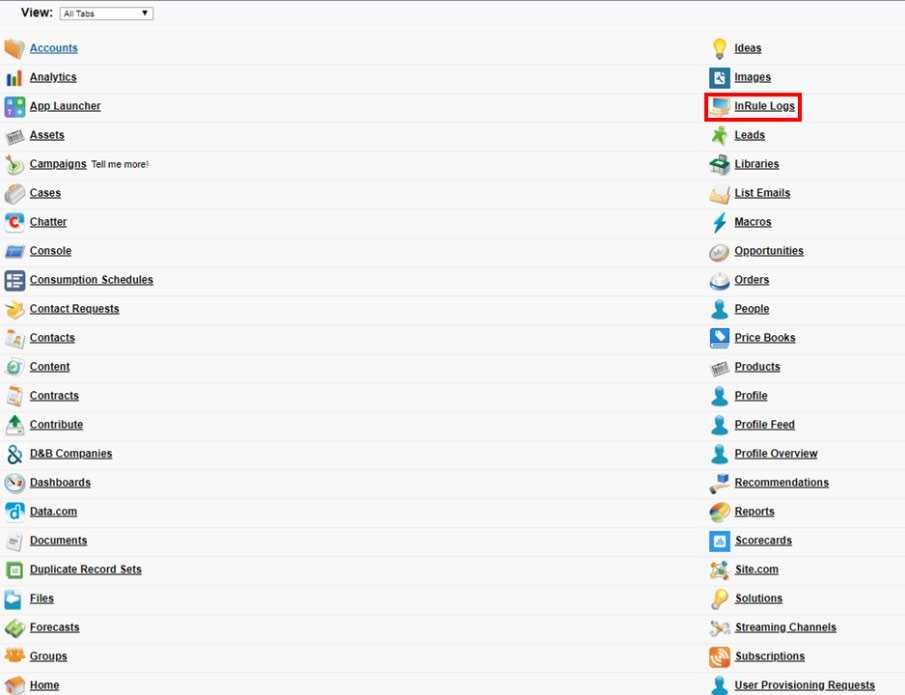
After installing the InRule for Salesforce App, a new custom tab to access the InRule for Salesforce App logs will have been added. To add it to your navigation bar, click the "+" at the end of the navigation bar.

A list of objects will appear. Select "InRule Logs"
You will be navigated to a new page displaying a list of any recent logs that may have been created. To view a list of all logs, select "All" from the dropdown list at the top of the page and select "Go!"
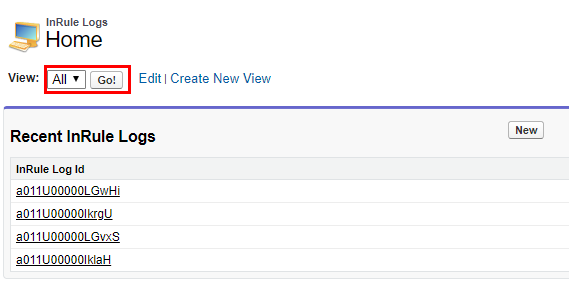
You can now view all logs created by the InRule for Salesforce App. To view more information about an individual log, you can click on the log ID to view the log details
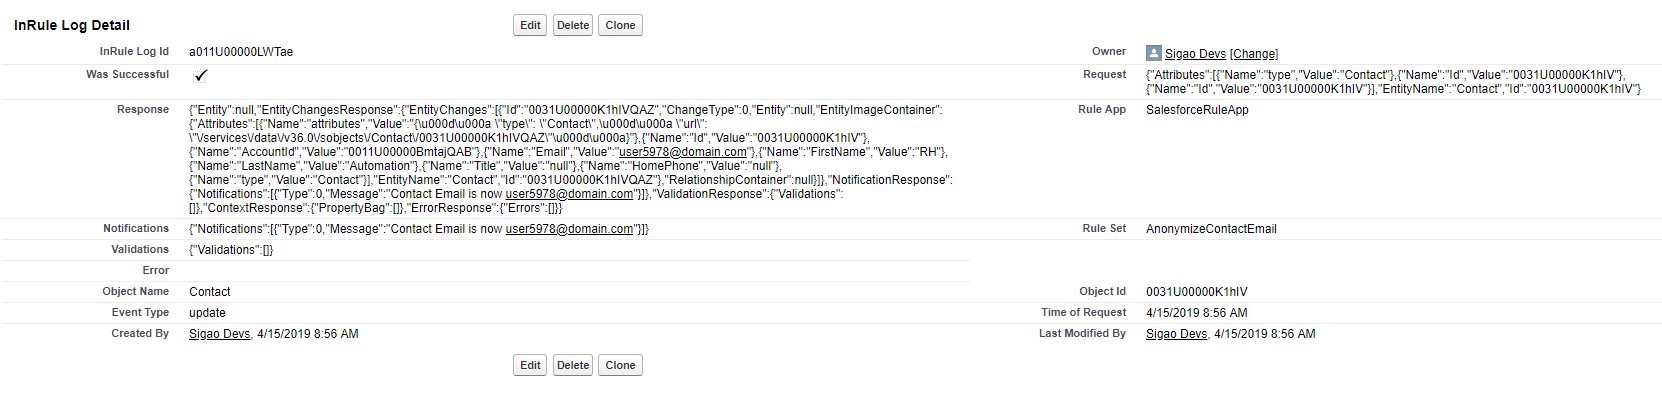
What fields are and aren't populated is determined by what logging level you configured.
Rule Execution Service Event Log
Event logging can be enabled in the Rule Execution App Service to monitor application events. These logs can be tremendously useful for debugging any issues encountered with the Rule Execution Service.
Viewing Application Event Logs
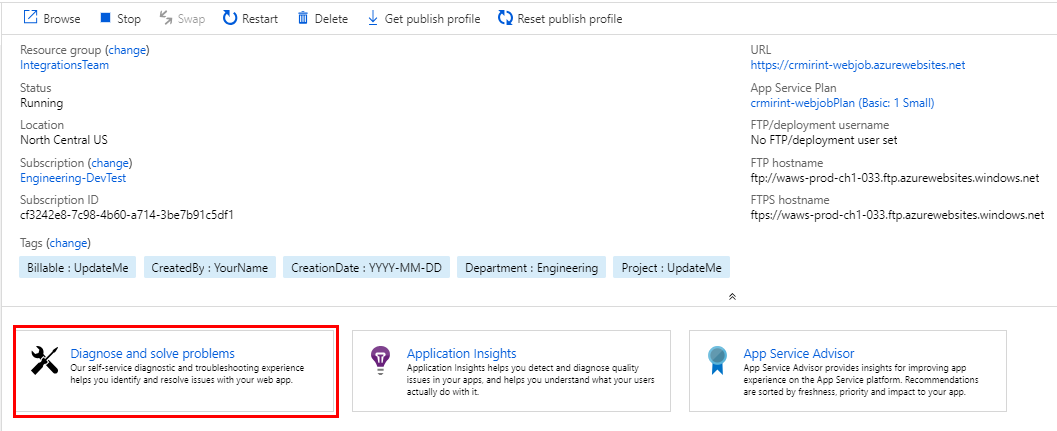
To enable event logging, login to Azure and navigate to your App Service as created as a part of the Azure deployment process detailed in Rule Execution App Service for Salesforce.
Once you're looking at the overview of your app service, select Diagnose and solve problems
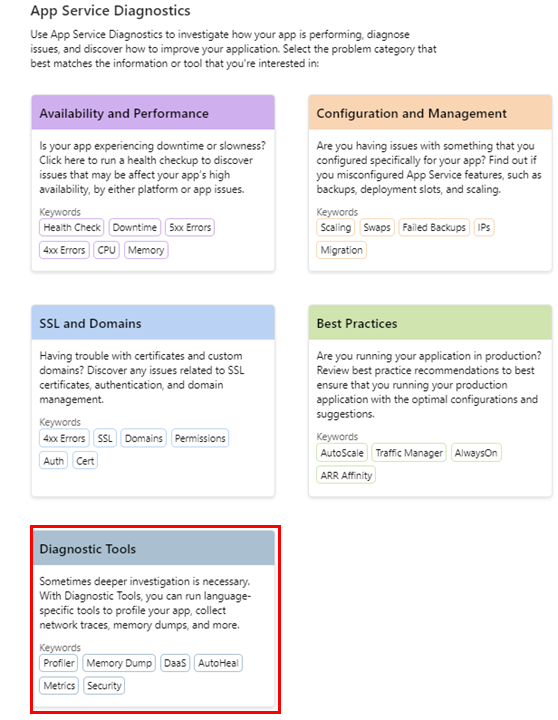
Select Diagnostic Tools
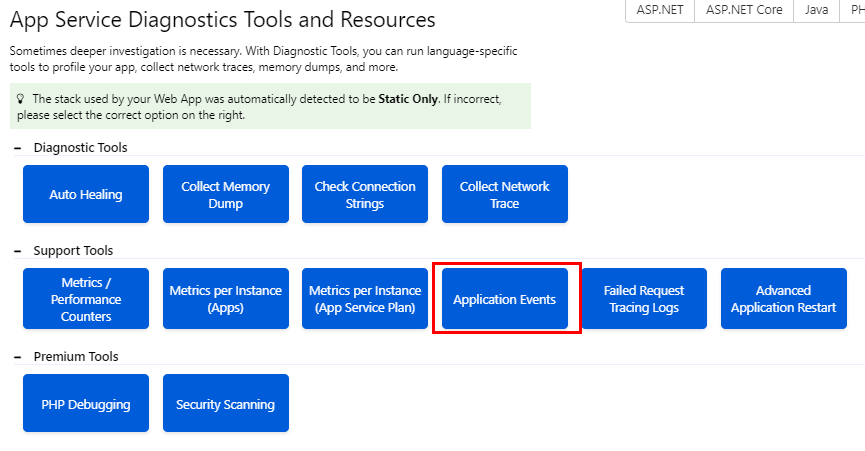
Select Application Events
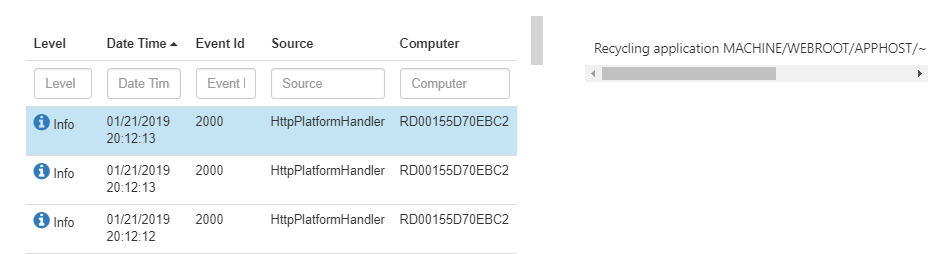
You should see a list of all application events logged by the rule execution service, denoted with the notification level, timestamp, event ID, source and web server. Selected an event log will cause the log details to appear in a separate column on the right-hand side of screen.
In the event of rule service issues, error events in this log stream can be useful for debugging purposes. For example, below is an example of an error event log in an instance where the rule service contacting the catalog looking for a rule application that didn't exist:
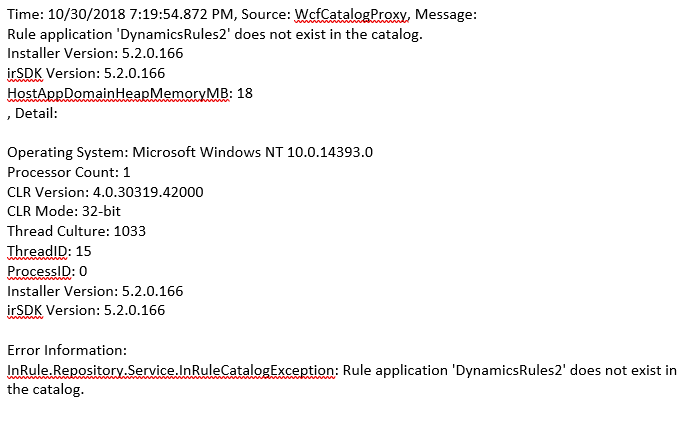
Typically, the response message at the beginning of the log and the Error Information section provide the most pertinent debugging information.
Adjusting Logging Levels
The Application Event Log can quickly become bogged down with too many logs, making finding specific logs that you may be interested in more difficult. To cut down on excessive informational logs, the Rule Execution Service, by default, will be deployed with a logging level of "Warn," meaning only Warnings and Errors will be logged. However, this can be adjusted as needed for whatever your needs may be.
To adjust your Rule Execution Service's logging level, navigate to your App Service as created as a part of the Azure deployment process detailed in Rule Execution App Service for Salesforce.
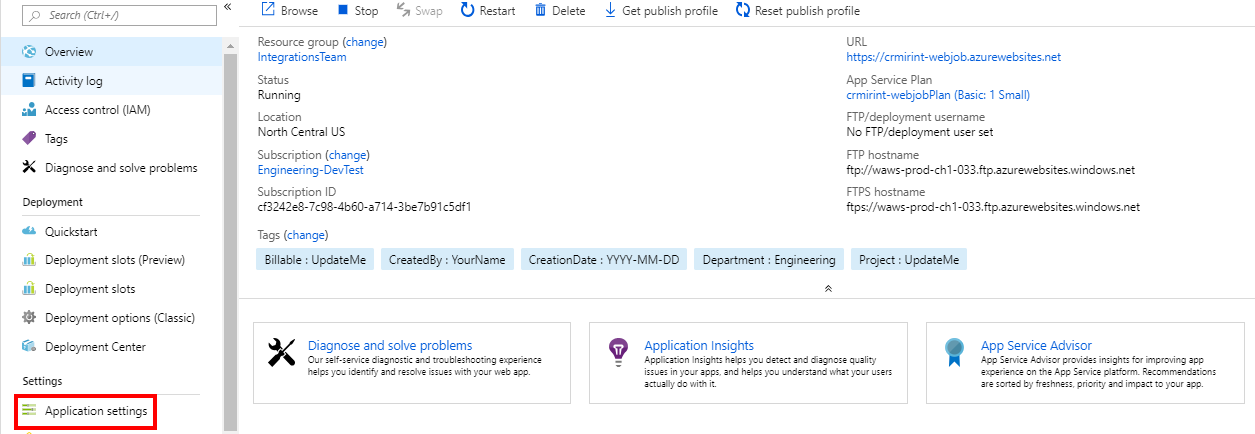
Once you're looking at the overview of your app service, select Application Settings in the settings menu:
Scroll down until you see the Application settings section:
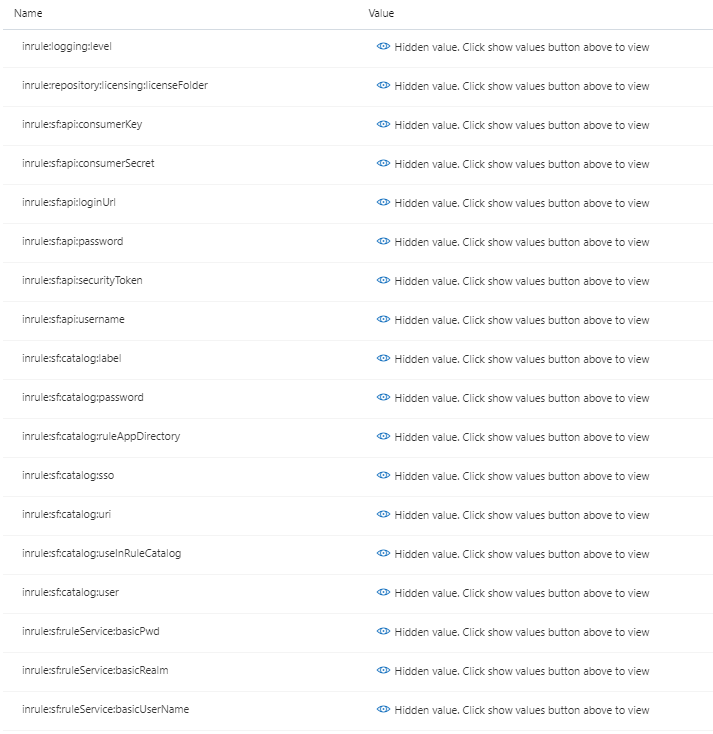
Locate the inrule:logging:level setting. Note that its value is currently set to "Warn."

Simply change the value to the desired logging level. You may select from one of the following levels that the Rule Execution Service leverages:
| Logging Level | Details |
|---|---|
| Info | Logs all application events, including Informational events that track the general flow of the application |
| Warn | Logs Warning and Error events. Warning events highlight abnormal or unexpected events in the application flow, but don't otherwise cause application execution to stop |
| Error | Logs only Error events. Error events result in the halted execution of the application's current activity due to a failure |
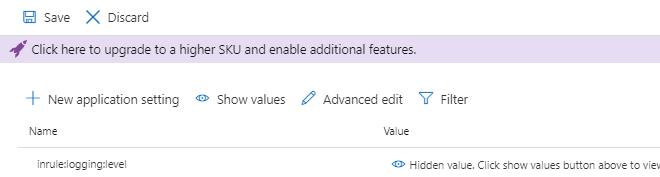
Once you have configured the setting to the desired to level, press Save at the top of the page:
Entity Loading Log
Enabling Info level logging on the Execution Service can provide more detailed performance data. The plugin trace log will include some summary data about the entire rule execution run, but the execution service can log specifics about entity data loading and rule execution from the service. To enable the info level logging set the "inrule:logging:level" app setting to "Info". For all installations this can be done by editing the web.config, but Azure-hosted services can also edit this setting via the Azure portal.
Setting this to "Info" will enable two sets of logs, the standard InRule SDK logs that appear for all InRule products, and the data loading logs that measure entity loading specific to the Salesforce integration. You can find all the details about the Event Logs on the InRule support site here. There are a variety of different events, but the 'ExecuteRuleSet' entry will contain some of the most important measurements, such as compile, execution and external call times.
However, these measurements only capture actual rule execution, and before rule execution happens the entity tree is loaded from Salesforce. The data loading log captures this information. When executing rules from Salesforce, only the root entity is sent from the plugin to the execution service, and the execution service will then use the rule app metadata to determine which relationships and entities need to be loaded. The execution service batches these requests for greater efficiency, but very large entity trees or network latency can still lead to long load times. The entity loading log breaks down the total loading time into each 'batch' of loading requests made, and lists the total load time and all entities loaded in the batch. This information can be used to identify where large numbers of entities are being loaded and how long particular batches take to retrieve from Salesforce.
Taken together, these logs can be used with the plugin trace log to get an end-to-end picture of performance, and help identify which steps consume the most time. An extract of a sample of the data loading log is shown below.
Entity Loading:
Total Loading Time: 911.5114ms
Total Org Service Time: 701ms
Root Entity: inr_projectprofile

Related Entities: inr_projectprofile -> account lookup <inr_account_inr_projectprofile> (1), inr_projectprofile -> inr_agreement lookup <inr_inr_agreement_inr_projectprofile_PrimaryAgreement> (1), inr_projectprofilegroup lookup <inr_inr_projectprofilegroup_inr_profile> (1), inr_projectprofile -> inr_agreement collection <inr_inr_projectprofile_inr_agreement> (2), inr_projectprofile -> annotation collection <inr_inr_projectprofile_Annotations> (33), inr_projectprofile -> inr_businessapplicationtype collection <inr_inr_businessapplicationtype_inr_projectpr> (1), inr_integrationdetail collection <inr_inr_integrationdetail_inr_projectprofile> (5), inr_projectprofile -> inr_runtimeapplicationtype collection <inr_inr_runtimeapplicationtype_inr_projectpro> (4), Time: 180.1637ms
Related Entities: account -> incident collection <incident_customer_accounts> (43), inr_agreement -> serviceappointment collection <inr_agreement_ServiceAppointments> (69), Time: 128.366ms
Related Entities: incident -> subject lookup <subject_incidents> (8), serviceappointment -> service lookup <service_service_appointments> (5), Time: 109.0635ms
In addition to always being logged on the execution service when Info logging is enabled, this log can also be returned in the response and logged to the plugin trace log for easier access.